
How Markets Actually Grow
Why company growth gets harder when you manage visible demand as if it were the whole market.

At a high-growth AI startup, the growth team had spent eighteen months building a system that worked. Search converted at a reliable rate. Retargeting caught buyers who fell off. Qualified pipeline held steady. The CEO liked the numbers.
Then new logo growth started flattening.
The quarterly review was confused. The dashboard still looked clean. Leads still matched the ICP. The recommendation in the deck: tighten the audience, cut channels that weren’t showing intent, push harder where the signal was strongest.
Every move made sense. That’s the problem.
I’ve sat in this meeting. Or something close enough to it that the difference doesn’t matter.
They were being responsive to an accurate picture of visible demand. The rest of the market wasn’t in it.
The category was growing fast. More buyers were in-market than a stable, mature category produces. But most of them were entering for the first time: companies that had never bought in this space before, didn’t know who any of the vendors were, and weren’t in anyone’s CRM yet. Those buyers were not in the data.
Growth gets harder when the system is optimizing inside the wrong model of growth.
The market is bigger than the demand you can see
The easiest part of the market to manage is the part already moving.
That’s why current demand dominates so much modern marketing thinking. It fills the CRM, throws off conversion signals, and gives you something concrete to improve this quarter.
It’s only part of the market.
Professor John Dawes at the Ehrenberg-Bass Institute put a number on this: in most B2B categories, roughly 5% of potential buyers are in-market at any given quarter. The other 95% are not. But they will enter the category eventually. That is the 95:5 rule.
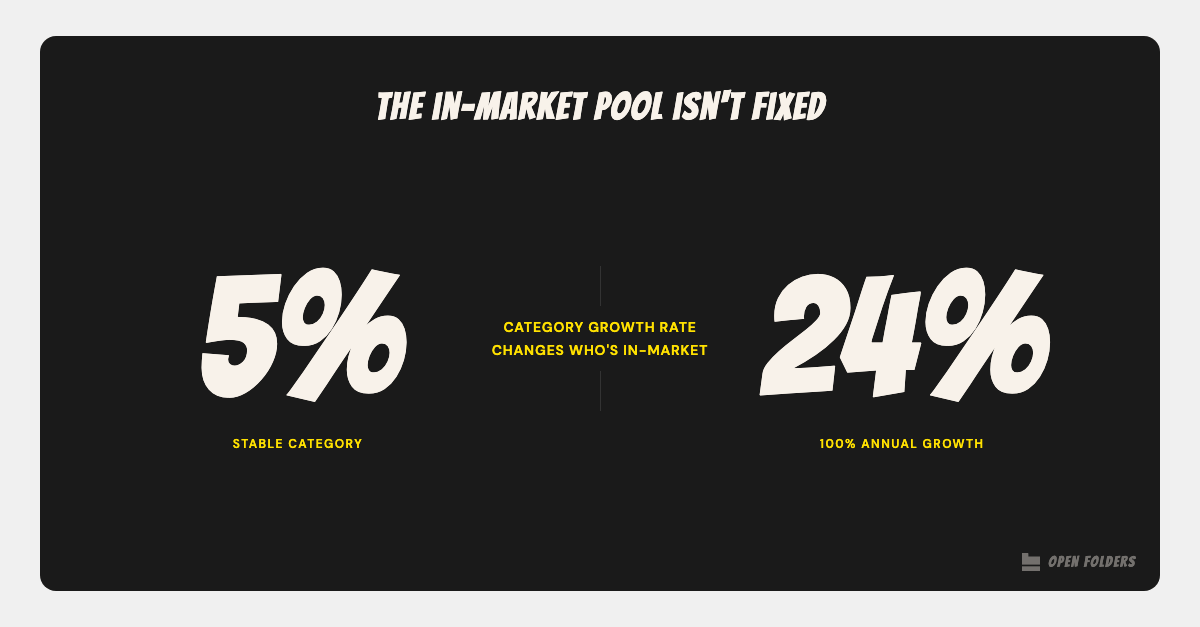
Dale Harrison showed that 5% is a floor, not a constant. The 95:5 rule derives from a model of buyer purchase frequency that Ehrenberg himself constrained to stationary markets: categories that are not growing. In growing categories, first-time entrants flood the in-market pool.
At zero category growth, roughly 5% of buyers are in-market.
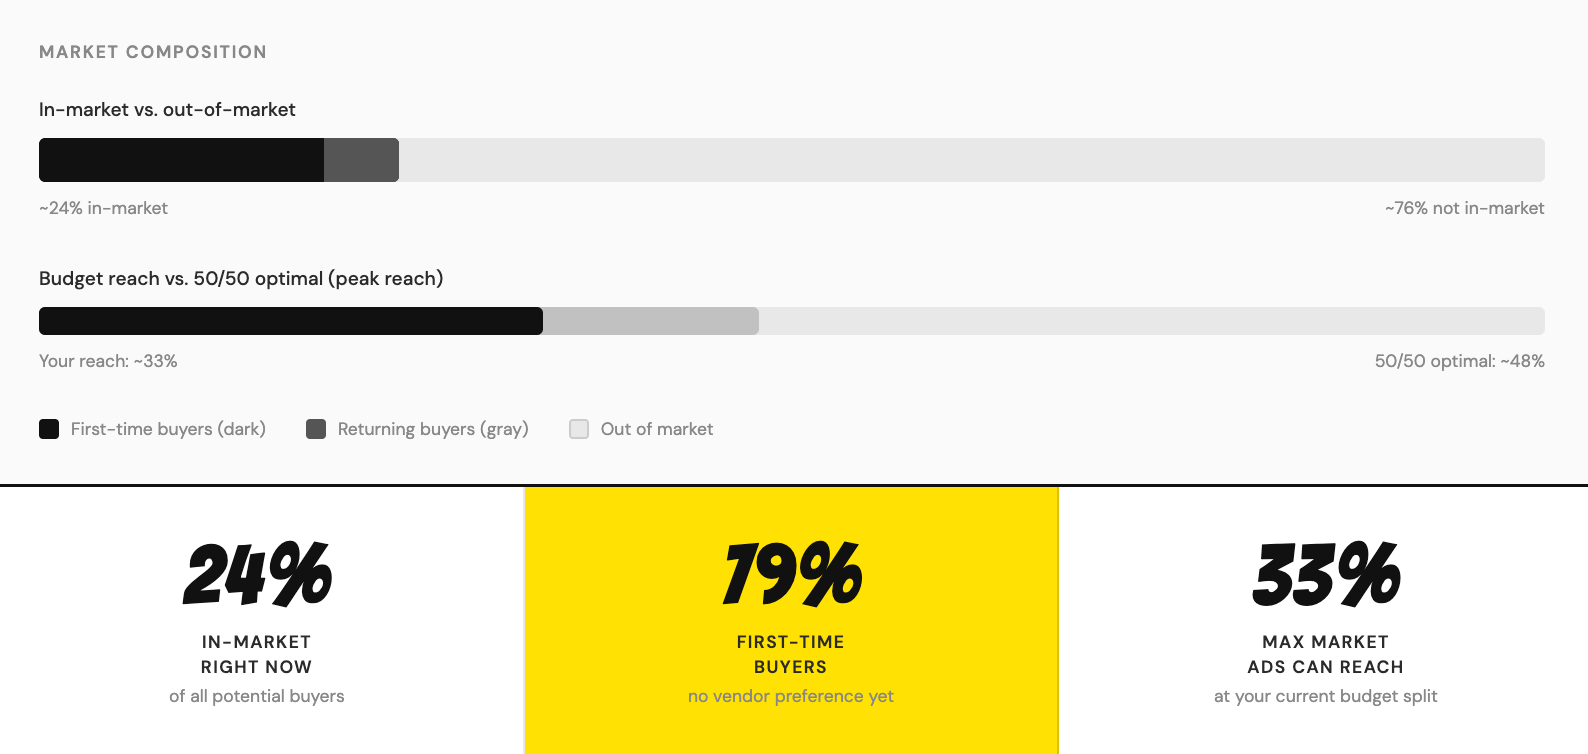
At 100% annual category growth, that figure reaches around 24%.
Roughly 80% of those in-market buyers are entering the category for the first time, with no prior vendor preference.
Both models share one assumption: the problem being solved is stable. Category growth rate is the variable; buyer intent is not. Buyers enter a category because the need exists and the solution type is the right answer to it.
In categories being actively disrupted, where AI is pausing buying processes to evaluate whether the entire solution category still applies, he effective in-market pool isn’t purely a function of growth rate. The 5% assumes the problem is stable. What happens when the problem itself is in play?
See how your category growth rate and buying cycle shift the in-market math: Category Demand Calculator
Visible demand feels bigger than it is because it’s louder than everything around it. It shows up in dashboards, pipeline reviews, and weekly meetings. It gives you proof. Or something close enough to proof to keep the system running.
The system was capturing the exhaust fumes of the active 5%.
The part of the market you can measure most easily isn’t the part that matters most for growth.

Company growth is not the same as market share growth
The language gets slippery here.
If the category is growing and a company keeps roughly the same relative position, revenue still goes up. More buyers enter the market. The pie gets bigger. Revenue follows.
Market share growth is harder. It means getting relatively bigger than competitors.
These aren’t interchangeable, and marketers often write as if they are. Harrison makes the distinction clearly: many brands grow by taking their share of underlying category expansion, while actual share capture is a different and slower problem.
For example, a startup growing revenue at 40% YoY in a category growing at 100% is losing ground. The dashboard records growth and the team gets praised. But the competitive position quietly falls. Most teams don’t find out until category growth normalizes and the gap has already compounded.
Brands usually grow through more buyers, not mainly through more loyalty
When growth slows, most teams reach for the same answer.
Improve retention. Increase loyalty. Work the base harder.
That instinct is understandable. Existing customers are easier to see, easier to model, and usually cheaper to reach. They’re also not where the growth is.
The core finding from Byron Sharp’s How Brands Grow and confirmed across Ehrenberg-Bass Institute research: bigger brands mostly have more buyers, not better loyalty. The main difference between larger and smaller brands is buyer base size.
Binet and Field confirmed the same pattern from independent data in their IPA analysis: penetration drives business growth as the primary factor in 22% of cases; loyalty drives it alone in just 7%.
Research from Barker-Trowse, Dunn, Graham, Sharp, and Corsi covering more than 1,500 brands and $30 trillion in retail sales over 25 years puts a number on it.
That’s the law of double jeopardy. Smaller brands have fewer buyers. And those buyers split their purchases across more brands, including larger ones, so purchase frequency with the smaller brand is lower.
The playbook doesn’t change the math. Even small brands grow primarily through increased penetration, not by extracting extraordinary loyalty from a narrow niche.
Many companies hit the performance plateau here and start solving the wrong problem. They have a buyer-base problem and reach for a loyalty playbook.
Why ideal customer thinking can quietly shrink the market
The ideal customer profile is a useful sales tool.
It’s often a poor growth doctrine.
Nothing is wrong with having a clear picture of who converts most easily or where the best near-term fit sits. That focus helps teams make tradeoffs.
When that execution tool becomes the whole theory of growth, the market starts shrinking inside the company’s head. Buyers unlikely to convert this quarter look irrelevant. Broad reach looks wasteful. Memory-building looks soft. Buyers outside the narrow definition of fit get treated as noise.
(If you want a diagnostic for where your growth system is actually stuck, the 5Ms Constraint Map covers the most common failure patterns. Narrow market definition is usually the first one.)
Binet and Davis’s analysis puts numbers on this pattern: 56% of marketers target sub-segments rather than the full potential market, and 68% focus their budgets almost entirely on the 5% of buyers currently in-market (Medialab CMO Survey 2025, cited in Go Big or Go Home, IPA 2025).
Tight targeting is efficient when the job is converting current demand. Broad reach matters when the job is creating future demand across all category buyers.
The ideal customer profile is often a good description of the easiest buyer to win today, not the full set of buyers who create growth tomorrow.
What does “TOFU” really mean
In most marketing reviews, somebody says “top of funnel” and the room nods.
Half the room means people actively searching. The other half means people who have never heard of you.
Same phrase. Different markets. Different strategies.
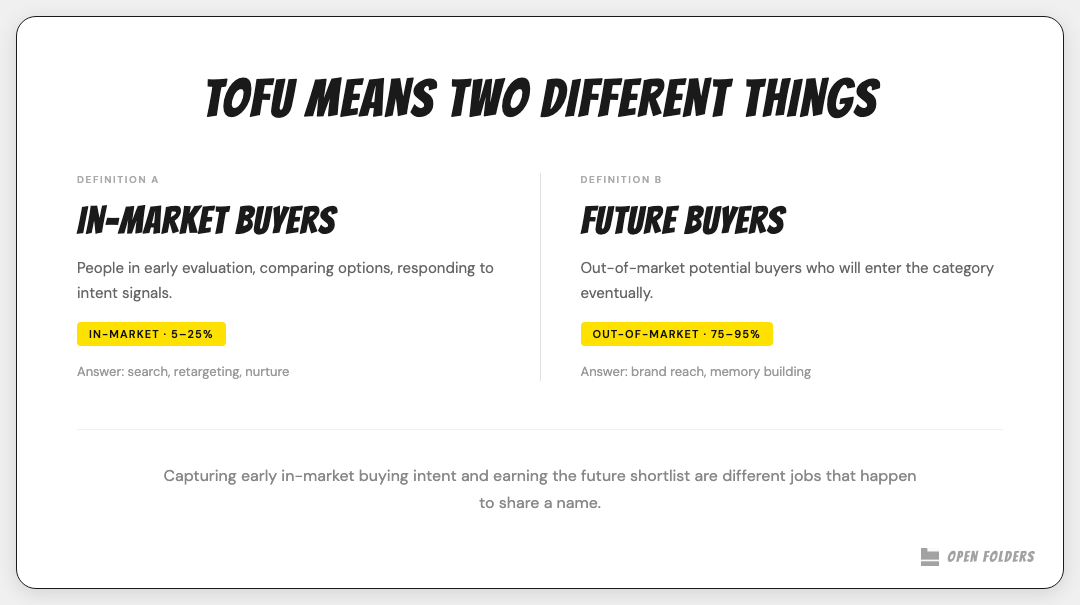
The first version treats the funnel as a buying process: TOFU buyers are 5-25% of people in early evaluation, comparing options, responding to intent signals. The answer is search and nurture.
The second version treats the funnel as a map of the whole market: TOFU is the 75–95% of potential buyers who are not currently in-market. The answer is brand reach and building retrieval before the buying moment arrives.
Both are coherent. However, they describe different audience populations. When the same marketing meeting uses both without naming the difference, the conversation about where to invest goes sideways fast.
The in-market math changes which definition applies. In a stable category, TOFU-as-buying-process captures most of the available pool. In a fast-growing category where a quarter of potential buyers may be in-market and most are entering the category for the first time, that definition misses the majority of the growth opportunity.
Before any funnel strategy conversation: name which version of the funnel the room is using. Most rooms never do.
Mental availability is retrieval, not reflection
Mental availability is usually explained as awareness.
That’s too soft.
What matters is whether the brand comes to mind easily in the specific situations that pull someone into the category.
That’s a retrieval problem.
At that startup, the best-qualified lead in a quarter didn’t come from a campaign. Direct email. First line: I’ve been aware of you for a while. I have a problem I think you solve. He hadn’t filled out a form. He wasn’t in the retargeting pool. By the dashboard’s logic, he didn’t exist until he sent that email. That’s retrieval. A name surfacing at the moment a problem becomes urgent enough to act on.
CEPs are the situations that pull buyers into a category, and mental availability is the result of showing up in those situations consistently. Why Nobody Ever Got Fired for Buying IBM (Hint: Thinking is Hard) covered what happens when familiarity exists but the conditions for action don’t.
The growth rate context adds one dimension those posts didn’t need: first-time buyers have no retrieval history. They haven’t formed a shortlist yet. The brand that reaches them before they search is the only one that gets considered when the moment arrives.
A lot of brand research still asks reflective questions after exposure. What did you notice? What did you like? What do you remember? Those answers are useful diagnostic inputs. They’re not commercial readiness signals.
Reflection is recognizing someone from chemistry class at a ten-year reunion. You know them when you see them. Retrieval is the tow truck company already on speed dial at 2am on the highway. One is memory. The other is a commercial reflex.
An ad may test well because people can clearly repeat the message back. That’s reflective fluency. A simpler brand cue, repeated consistently over time, may do more commercial work. The explanation has nothing to do with research performance. Consistent, simple cues train retrieval under actual buying conditions.
Performance metrics tell you how efficiently you’re converting current demand. Brand metrics tell you how much future demand you’re building. The dashboard only runs one of them.
The industry still overrates advertising that performs well in research conversations and underrates advertising that performs in markets.
CEPs tell you where to show up when buyers are already moving. Demand spaces determine whether they’ll be moving at all. The framework centers on the aspirations and contexts that create categories before buying situations exist. Different frameworks. Different time horizons.

Quick to mind, easy to find
Being easy to think of isn’t enough.
In growing categories, physical availability carries extra weight. First-time buyers have no existing vendor relationship to return to. They’re discovering the category fresh, navigating it without a map. The brand that’s easy to find, easy to evaluate, and easy to buy from has an advantage that has nothing to do with product quality.
Hartnett’s foreword to How B2B Tech Brands Grow frames it plainly: presence and prominence in the places buyers buy from the category, including sales access and product options that make the brand more buyable for more of the market.
Mental availability creates a pre-sold buyer. Physical availability determines whether the brand is actually buyable when that moment arrives. As Hartnett puts it: quick to mind, easy to find.
Small brands and B2B aren’t exempt
These principles don’t disappear in small brands or B2B. The details change. The mechanics stay the same.
The pushback I heard most often at early-stage startups: penetration thinking is for consumer brands. We have fifty target accounts. Work the ICP. The founders who ran that playbook usually found out 18 months later that a less well-funded competitor had been showing up consistently in the communities where buyers form opinions, not running campaigns, just present in the right conversations. By the time an RFP arrived, the shortlist was already set.
The same research addresses the small-brand objection directly. Tiny brands grow in the same basic way as larger brands: mainly through increased penetration, not through extracting extraordinary loyalty from a narrow niche. Resource constraints are real. The growth mechanics aren’t exempt from them.
The B2B objection is different but the answer is similar. B2B buying is slower, more social, more constrained, and more visibly shaped by sales. None of that eliminates the need to be thought of and easy to buy.
Hartnett’s B2B tech research shows the same laws hold: bigger brands are easier to think of and easier to buy from; the main difference between larger and smaller brands is still customer base size; growth still depends on building mental and physical availability.
Being small changes the execution problem and being B2B changes the buying process. Neither changes what growth actually requires.
Market taking is not the same as market making
Performance-heavy marketing systems are often very good at winning the auction once demand becomes visible.
Market taking is about harvesting demand already in motion: intercepting active buyers, reallocating existing choice, improving the odds of winning this round.
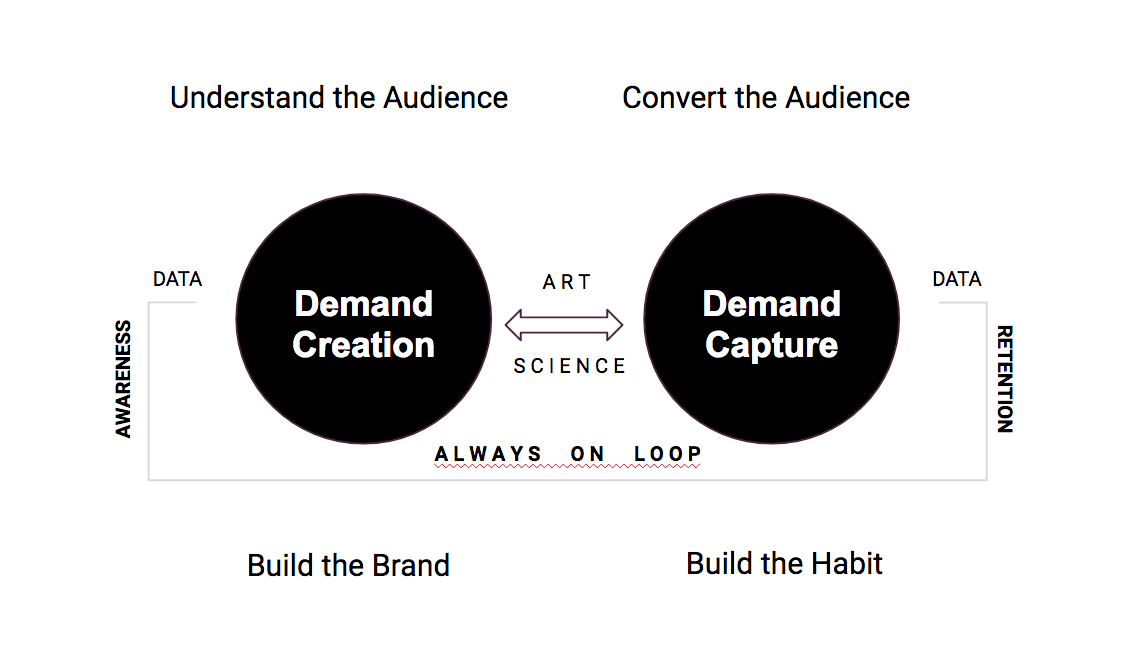
Market making is different. It’s about increasing the number of buyers who know the brand, can retrieve it, and can buy it when their moment arrives. It works earlier. It works more slowly. It matters because most buyers aren’t in-market right now.
WARC’s Multiplier Effect research shows this directly: stronger brand equity improves the efficiency of performance advertising, and overinvesting in performance alone creates a compounding penalty as that multiplier weakens. (The full argument is in The Say-Do Gap Isn’t an Execution Problem.)
“Brand and performance both matter” is true but too weak. The more useful distinction: one helps win demand already in motion. The other shapes who gets considered when future demand turns current.
Those jobs reinforce each other.
Market taking is the RPM: combustion turning wheels right now, visible on the speedometer. Market making is the oil. It doesn’t move the car. It reduces friction across every moving part so the engine runs better on less fuel.
A dashboard that only measures wheel speed sees the oil as waste. So teams drain it to buy more fuel. For a quarter or two, the car runs fine. Then the friction builds. The cost of the same output keeps rising.
When teams are only judged on the visible slice they can measure, they get better at taking market and worse at making one.
Your marketing dashboard isn’t lying
The dashboard told the truth.
It was describing the loudest part of the market.
Visible demand matters. Search matters. Conversion work matters. Sales efficiency matters. None of that is fake. Treating those signals as the whole map is the mistake.
Company growth in the core market depends on something broader.
More buyers able to think of the brand easily in buying situations.
More buyers able to find it and buy it when the moment arrives.
Measurement that can tell the difference between what buyers can articulate in conversation and what they actually retrieve in market.
A wider picture of what rigor means, not less of it.
Visible demand is smaller than the total market. It also shows up later than the moment growth really begins.
The Monday version
At your next growth review, ask one question before the deck goes up:
What percentage of our marketing budget and activities are designed for buyers already in-market versus buyers who will enter the category in the next 12 months?
Most teams can answer the first half immediately. The second half usually gets a long pause.
Explore how your category growth rate and buying cycle shift the in-market math: Category Demand Calculator
Opening Folders, JD